The 2010-11 calibration of the Coldrick Optical Observatory were the BSc final year projects of Will Foxall and Richard Painter.
Images of the year are available for viewing here.
All the observation data was taken over two observation evenings using the telescope and the ST-7E CCD calibrations were conducted steadily over the course of a few months, before observing took place.
As a result, an in-depth understanding of the CCD and its limitations was acquired and an analysis on the potential of the observatory setup as a whole was made. The results from the investigation are outlined below:
CCD Calibrations:
- -5°C operating temperature was found to be suitable for all observations.
- The CCD was found to respond linearly to dark current and photons up to approximately 40,000 ADUs.
- Three classifications of defective pixels were formulated, all of which were constant in their location on the CCD.
- The proportions of the CCD taken up by each defective pixel group were:
Pixel Type % of entire CCD Method of Masking/Classification Hot Pixels 9.31 Iterative 5 standard deviation cut-off Warm Pixels 35.81 Pixels with values above the mean in 20 half hour exposures every time. Cool Pixels 8.28 Pixels with values below the mean in 20 half hour exposures every time. - All defective pixel group behaviours were not linear with time such that their contribution could not be accounted for via dark frame subtraction (see scaled subtraction of 30min dark from 5min dark with an un-Gaussian shape in the 2010-11 reports).
- The CCD housing was found not to be entirely light tight and dark frames needed to be taken in a light tight environment.
Observatory Arrangement Potential and Limitations:
- The seeing was the most significant limiting factor on resolving power which was, at its best, 3.46 arcseconds.
- The Nyquist limit is 2.32 arcseconds and may become the most significant limitation on a night of exceptional seeing.
- The diffraction limit 0.62 arcseconds
- Photometry measurements fell close to literature values of the magnitudes of the stars. However, they were not encompassed by the errors calculated by count statistics and instrumental errors. There is likely a larger contribution in photometry errors imposed, again, by the atmosphere.
Observation Summary:
An Excel spreadsheet, detailing a full summary of the astronomical sources observed on both observation nights (07.03.11 & 24.03.11) can be found below:
The spreadsheet includes the following information:
- Names of sources viewed
- Exact time each source was viewed
- Number of observations and exposure times
- Spectral type of each source
- r' magnitudes (theoretical, empirical & calibrated). Calibrated magnitudes were calculated using the "offset" calibration approach.
Zero-Point Calibration:
There are 2 options to compare empirical versus textbook r' values. This enables a "calibrated" r' value to be produced, which is closer to the textbook r' value:
1. Offset Magnitude Calibration:
Using the above spreadsheet, calculating average (absolute) difference between empirical & textbook r' values. Then, include this difference to the empirical r' values to obtain the "calibrated" r' magnitude. The average magnitude calibration factor calculated was:
| 07.03.11 & 24.03.11: | 3.0364 |
|---|
The average difference (accuracy) obtained between calibrated & textbook r' values was therefore:
| 07.03.11 & 24.03.11: | 0.1254 |
|---|
2. Zero-Point Magnitude Calibration:
An alternative to the "offset" magnitude calibration approach was proposed by R. Morris. This approach is based on the Photometric Zero-Point Magnitude Calibration method. This method is explained at the following url:
http://www.stsci.edu/hst/wfpc2/Wfpc2_dhb/wfpc2_ch52.html
The data used to calculate the Zero-Point Magnitude Calibration factor for the 2010-11 BSc Project is listed in the Excel spreadsheets shown below:
Photometric Analysis, 07.03.11.xlsx
Photometric Analysis, 24.03.11.xlsx
The Zero-Point Magnitude is defined as "the magnitude of an object that produces one count (or data number, DN) per second". The calibration steps used to calculate the Zero-Point Magnitude constant are explained below:
- Taking the formula for the difference in magnitude between 2 sources, where m1 & m2 and F1 & F2 are the visual magnitudes & fluxes (# counts / second) from each source respectively:
m1 - m2 = 2.5*log10(F2 / F1)
- Set m1 to ZEROPOINT and F1 to 1, as per the definition of the Zero Point Magnitude:
ZEROPOINT - m2 = 2.5*log10(F2)
- Therefore, the magnitude of an arbitrary object producing a flux, F (# counts / second) in an observation is:
_m = \-2.5*log10(F) + ZEROPOINT_
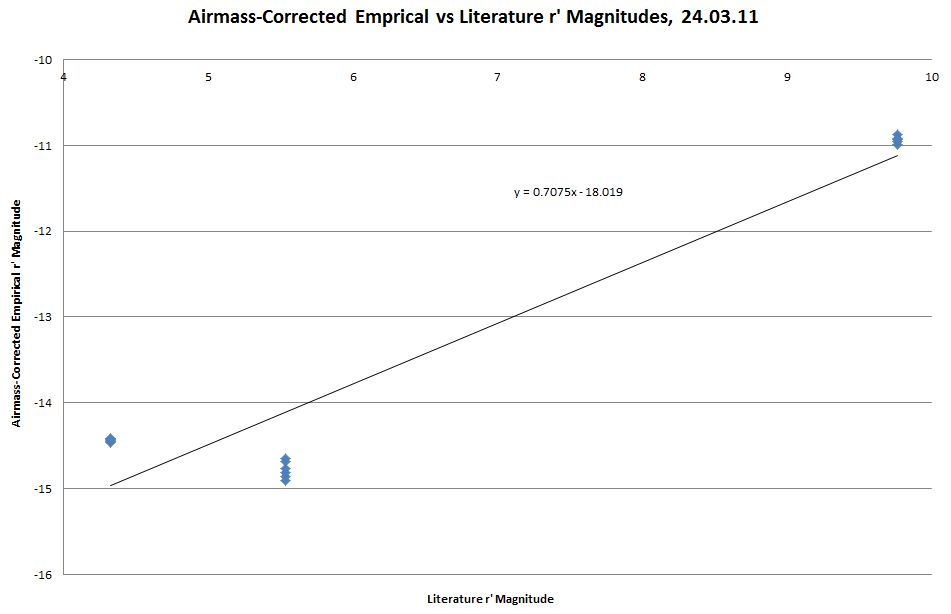
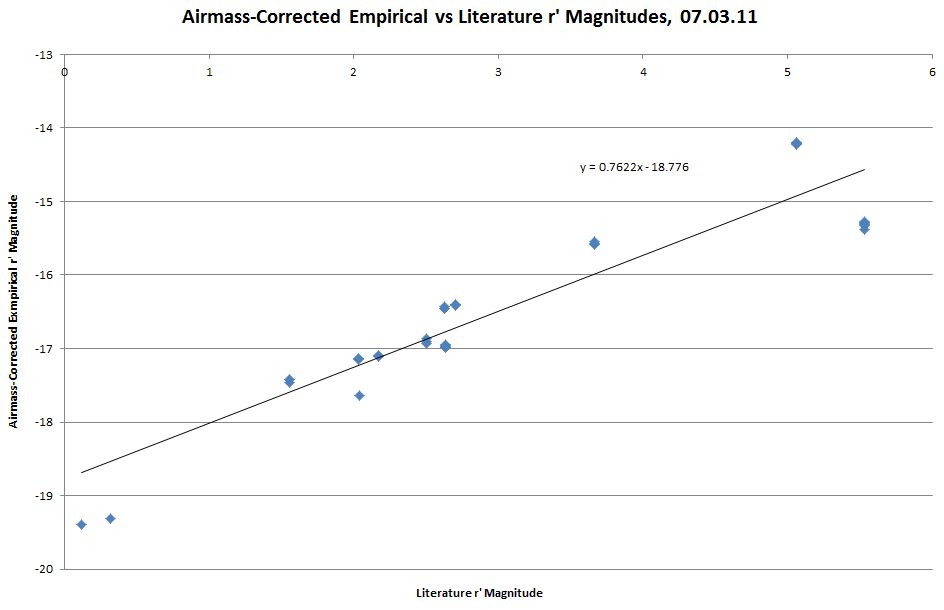
- By plotting the empirical vs. textbook r' magnitudes of the sources observed on each night, the y-axis intercept (value for a r' textbook magnitude of 0) was therefore taken as the Zero-Point Magnitude Calibration constant. The graphs plotted are shown below.
The Zero-Point Magnitude calibration constants were found to be:
| 07.03.11: | 18.776 |
|---|---|
| 24.03.11: | 18.019 |
Applying this constant to the empirical r' magnitudes, this resulted in "calibrated" r' magnitudes with the following accuracies:
| 07.03.11: | 0.749 |
|---|---|
| 24.03.11: | 1.857 |
It is clear that the accuracy was better on the 07.03.11 observation date, which may be explained in part by the since an accurate flat-field frame was not taken on this night. In addition, the accuracy using the "Zero-Point Magnitude" calibration method is less accurate than the "Offset" calibration method.
It is recommended that this topic is investigated further by future BSc/MSc Project students working on the UoB Coldrick Telescope.
|
| Figure 1: Zero-Point Magnitude Calibration graph, for the 07.03.11 observing night. The plot shows empirical vs. textbook r' magnitudes. The y-axis intercept is -18.776, implying that this value is the Zero-Point Magnitude constant for the 07.03.11 observing night. |
|
| Figure 2: Zero-Point Magnitude Calibration graph, for the 24.03.11 observing night. The plot shows empirical vs. textbook r' magnitudes. The y-axis intercept is -18.019, implying that this value is the Zero-Point Magnitude constant for the 24.03.11 observing night. |